Accessing NCBI data with the Rentrez package
R Community of Practice June 15 - July 20
7/13/23
Learning Goals:
Our goals for today are:
- Become familiar Rentrez.
- Learn basic search functions.
- Extract information from the esumaries.
The Data
Scenario:
Today our data comes from PubMed, a National Center for Biotechnology Information (NCBI) database. Our data outputs, will contain bibliographic information about our search query.
Challenges of Working with Data from an Unknown Source
- The data may not arranged in a standardized format (BIBFRAME, MARC, METS, MODS, EAD…)
- The source documentation may be incomplete, or may not answer our questions.
- Not knowing what extra steps we may need to take to clean the data, so it can be usable.
We want to accomplish the following tasks:
- Download
Rentrez. - Perform simple and boolean searches.
- Create a graph using your search results.
What is Rentrez?
Rentrez is an R interface that allows its users to interact with NCBI API.
With Rentrez, you do not need to use any additional program or terminal to access NCBI Data.
This means that you can request data from multiple databases (PubMed, SNP, Clinvar, SRA, Gene, and others) in the same RStudio Session.
Install and Load Rentrez
Now, remember that you need to install any new package that you want to use in RStudio. Also, once you have the package you need to load it.
Rentrez Functions
The functions listed below help you learn a little bit more about Rentrez and NCBI Databases.
| Function | Usage |
|---|---|
| entrez_dbs() | List of Entrez Databases |
| entrez_db_summary() | Brief description of what the database is |
| entrez_db_searchable() | Set of search fields that can used with this database |
Performing searches with Rentrez
The functions listed below help you perform searches to a NCBI Database.
| Function | Usage |
|---|---|
| entrez_search() | Allows you to perform simple or boolean searches |
| entrez_summary() | Allows you to retrieve basic information about the records found |
| extract_from_esummary() | Extract elements from a list of esummary records |
entrez_search()
Similar to PubMed, Rentrez allows you to perform simple or boolean searches using the same structure that you would use in the PubMed search bar. The allowed boolean terms are AND, OR, and NOT.
First, let’s learn the syntax for a simple and a boolean search:
Simple Search:
Boolean search:
entrez_summary()
Now let’s retrieve basic information about the records we collected in one of our searches. But, first, let’s learn the syntax of the entrez_summary() function.
extract_from_esummary()
This function helps you navigate through an XMLInternalDocument and extract elements from a list of esummary records. But, first, let’s learn the syntax of the extract_from_esummary() function.
Exercise: Let’s practice!
Now lets perform our own searches!
We are going to use the Rentrez functions to extract data from an NCBI database.
Our objective is to:
Build your query: Identify your search terms, adequate database, search fields and perform the search using rentrez.
Get article/object summaries.
Select the values that you would like to save (for example author, title, source).
Create a graph that represents the results of your search.
STEP #1
Build your query: Identify your search terms, adequate database, and search fields and perform the search using Rentrez.
STEP #2
Get article summaries
List of  51 esummary records. First record:

 $`37247622`
esummary result with 42 items:
 [1] uid               pubdate           epubdate          source
 [5] authors           lastauthor        title             sorttitle
 [9] volume            issue             pages             lang
[13] nlmuniqueid       issn              essn              pubtype
[17] recordstatus      pubstatus         articleids        history
[21] references        attributes        pmcrefcount       fulljournalname
[25] elocationid       doctype           srccontriblist    booktitle
[29] medium            edition           publisherlocation publishername
[33] srcdate           reportnumber      availablefromurl  locationlabel
[37] doccontriblist    docdate           bookname          chapter
[41] sortpubdate       sortfirstauthor
STEP #3
Select the values that you would like to save (for example author, title, source)
STEP #4
Create a graph that represents the results of your search.
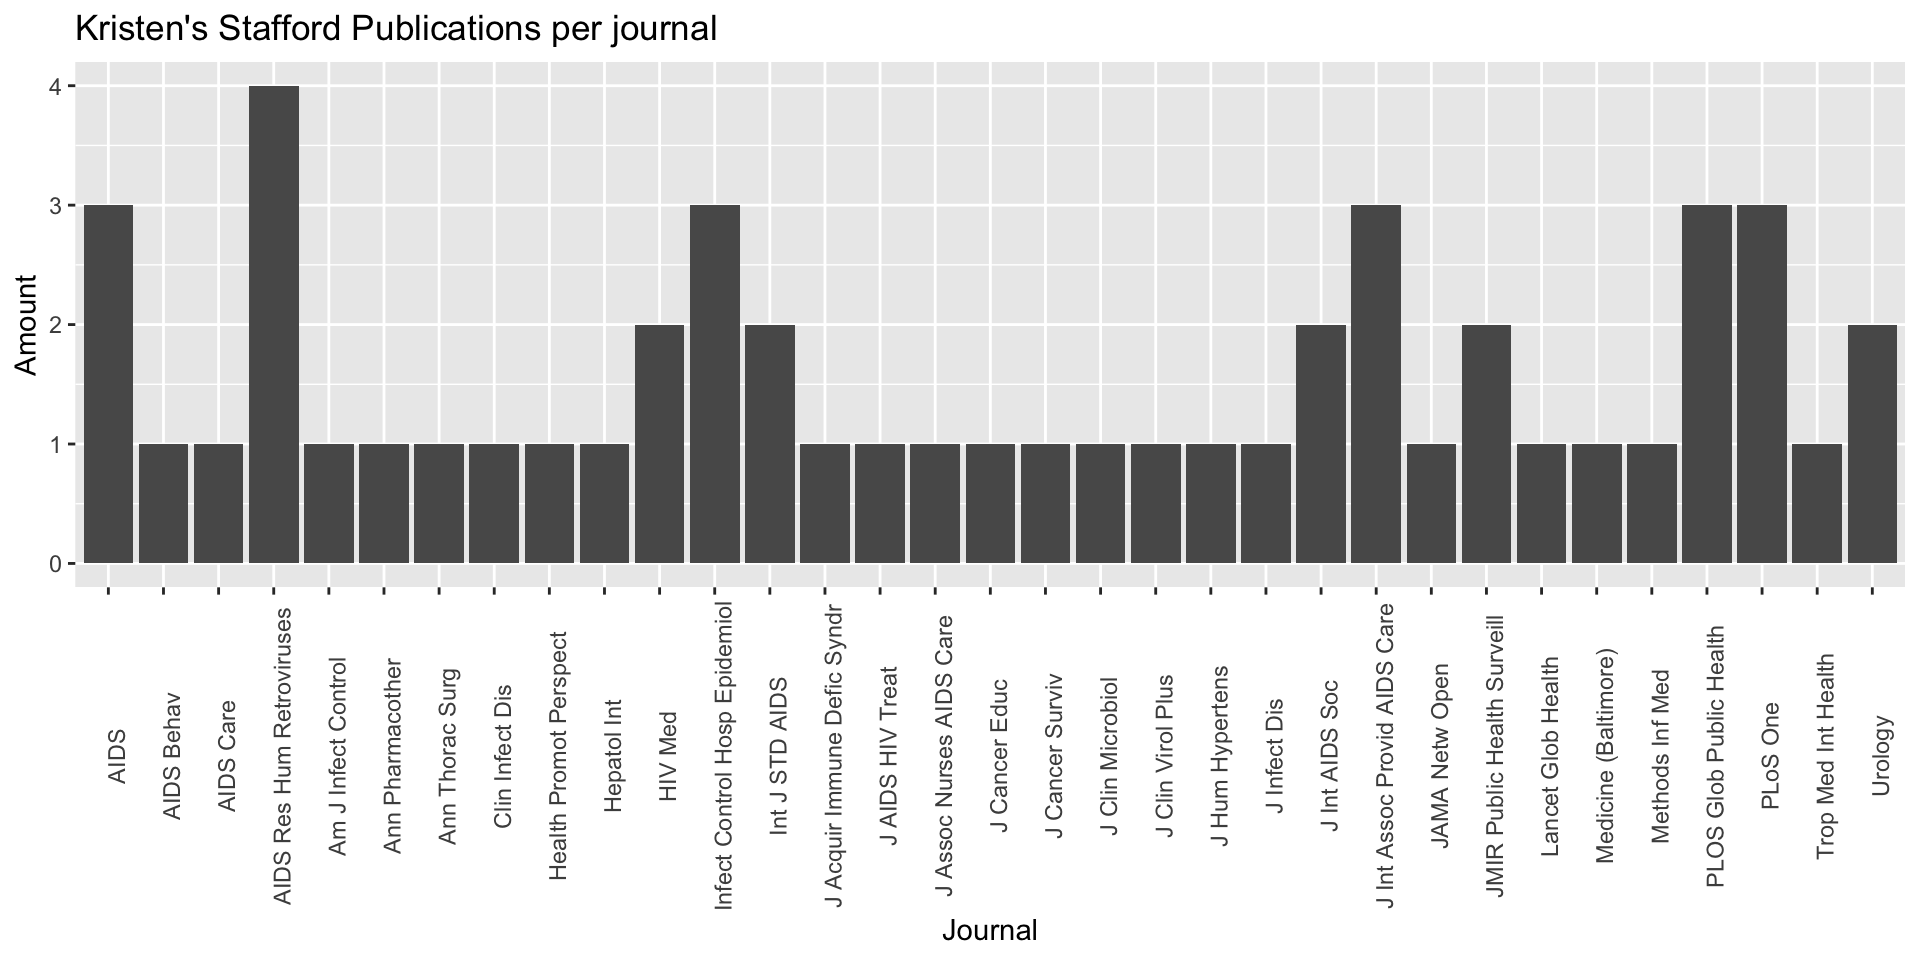
ggplot(mapping = aes(x=pubdate)) +
  geom_bar() +
  theme(axis.text.x = element_text(angle = 90)) +
   labs(title = "Kristen's Stafford Publications per year", # Set up graph title and labels
       x="Year", y= "Amount")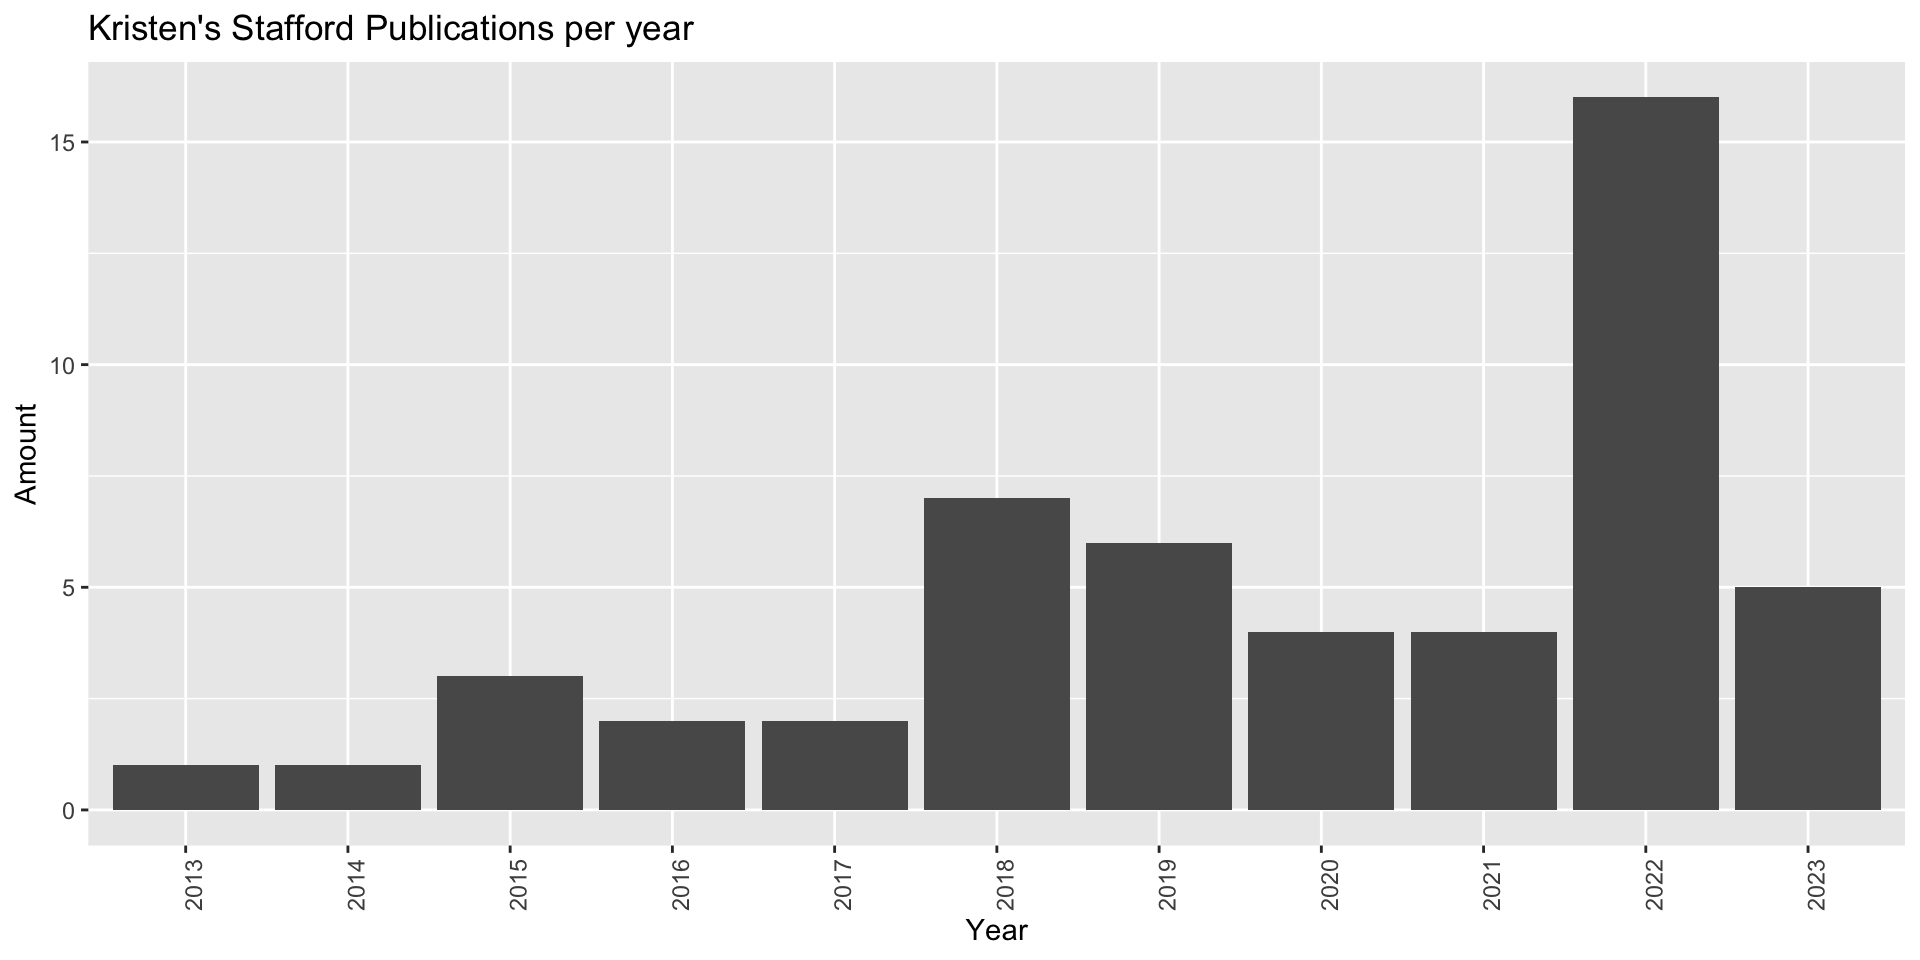
![]()